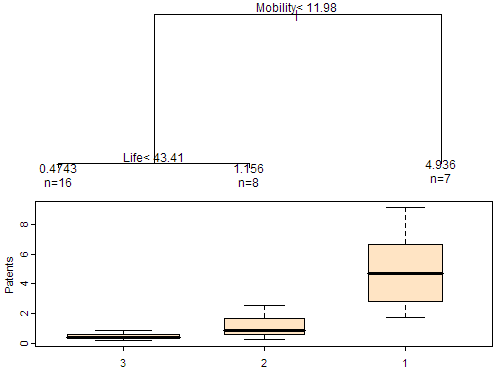
On April 22 I have given a presentation at the conference MEIDE2 on the topic of Population Qualities in Innovation. In my paper I just adopted the technique of “Classification and Regression Tree” (CART) to explore the relationship between the innovation output (measured by the average number of patents in a region) and several kinds of population qualities. In order to explain how CART works on data, I made two animated pictures for the audience:
The response variable was denoted by the size of bubbles and we want to find the optimum rule to split the 31 samples. For the regression trees, such a rule is just to find a splitting value for a certain variable to minimize the total within-group “variance”. So I first tried on the variable “mobility rate”, then “proportion of urban people”. In each animation, the process of splitting and computing variances was illustrated so that we can visually find the optimum value corresponding to the optimum variable. Below is the final tree: