Two months ago I was told one of my old blog posts was borrowed to this post: Finding patterns in big data with SAS/GRAPH. I wrote my blog post four years ago just for fun. The over-plotting issue is pretty boring to me now, but what caught my attention were:
- alpha-transparency was a new feature in SAS 9.3 (I found this hard to believe);
- the SAS code was so much longer (not surprising to me);
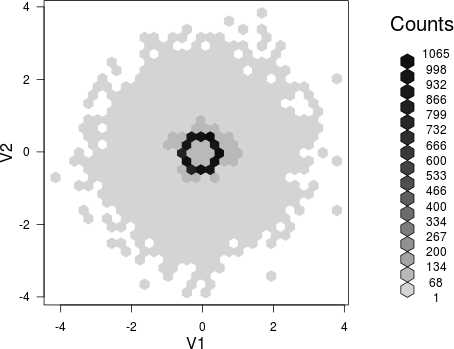
Well, I do not care and do not intend to start the boring war. If I were to write that post again, I would add the hexagon plot as yet another alternative.
library(hexbin)
with(x, plot(hexbin(V1, V2)))
Two personal announcements:
- I’ll be attending the Infovis Week at Seattle from Oct 14 to 17;
- I’ll pay a visit to the Department of Biostatistics at Johns Hopkins from Oct 23 to 24;
I’m happy to meet people nearby during these days. My Seattle schedule is pretty much empty; just let me know.