I was surprised to find the density estimation of a constant was also “bell-shaped” by default when a friend passed some R code to me to illustrate CLT, but I realized the reason soon.
x = rep(0, 1000)
par(mfrow = c(1, 2), mar = c(4, 4, 0.1, 0.1))
plot(density(x), main = "")
plot(density(x), main = "")
rug(jitter(x))
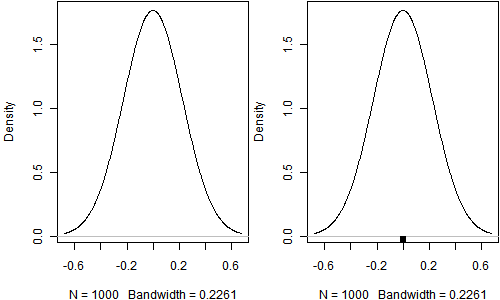
Note that I added a rug (jittered) to the right plot to tell you the true locations of the data points.