What we need to do is just use the parameter add = TRUE in the function of map() (package maps):
Source code:
if (require(maps) && require(mapdata)) {
par(mar = c(0, 0, 0, 0))
map("china")
bd = par()$usr #get the border
x = seq(bd[1], bd[2], length = 100)
y = seq(bd[3], bd[4], length = 100)
z = sqrt(outer((x - mean(x))^2, (y - mean(y))^2, "+"))
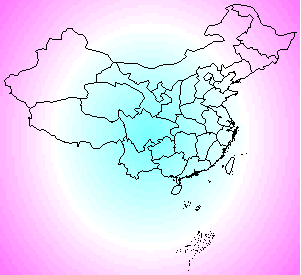
image(x, y, z, col = cm.colors(25), axes = F, xlab = "", ylab = "")
map("china", add = TRUE) # add the map to the color image
}
Packages maps and mapdata are required for the map of China.